| Address | 1915 Wells Branch Pkwy, Austin, TX 78728 |
| # of Units | 304 |
| Year Built | 1987 |
| Acquisition Date | 3/13/2025 |
| Purchase Price | $33,750,000 |
| Price per Unit | $111,020 |
| Price per SF | $168 |
| Total Loan Commitment | $24,500,000 (62.9%) |
| Total Equity Invested | $14,476,873 (37.1%) |
| Purchase Price | $33,750,000 |
| Acquisition Costs | $299,233 |
| Acquisition Fees | $540,000 |
| Capital Improvements | $2,666,538 |
| Reserves | $395,597 |
| Financing Costs | $1,000,147 |
| Total Cost Basis | $38,651,514 |
| Cost Basis per Unit | $127,143 |
| Cost Basis per SF | $192 |
| Escrows & Prepayments | $595,285 |
| Seller Pro Rations | ($269,925) |
| Total Closing Uses | $38,976,873 |
| Member | Contribution | Capital Share | Profit Share |
|---|---|---|---|
| Appian-Austin I LLC | $13,029,432 | 90.63% | 90.00% |
| SAF Indigo LLC | $720,028 | 5.01% | 4.97% |
| Alan Ware | $577,687 | 4.02% | 3.99% |
| Chelsea-Austin I, LLC | $50,000 | 0.35% | 0.35% |
| Chelsea Partners, LLCProfits Interest | $100,000 | 0.00% | 0.69% |
| Total | $14,477,146 | 100.00% | 100.00% |
Q1 generated positive operating momentum, though cash-flow recovery remains in progress. Prospect traffic increased, approvals improved, and physical occupancy rose 260 bps from the first week of January. General R&M and most other controllable expense lines landed at or below pro forma, with elevated turnover costs the only clear exception.
| Q4 2025 | Q1 2026 | Δ | |
|---|---|---|---|
| New Prospects | 229 | 368 | +139 |
| Applications | 45 | 58 | +13 |
| Approvals | 32 | 42 | +10 |
| Move-Ins | 30 | 34 | +4 |
| Move-Outs | 38 | 29 | −9 |
| Net Absorption | −8 | +5 | +13 |
| Floor Plan | Units | Avg SF | Market Rent | In-Place Rent | Rent Gap | Occupancy |
|---|---|---|---|---|---|---|
| A1 | 46 | 502 | $805 | $903 | +12.2% | 89.1% |
| A1P | 10 | 502 | $945 | $930 | -1.6% | 90.0% |
| A2 | 103 | 600 | $840 | $930 | +10.7% | 88.3% |
| A2P | 25 | 600 | $996 | $954 | -4.2% | 88.0% |
| A3 | 43 | 707 | $955 | $1,007 | +5.4% | 72.1% |
| A3P | 13 | 707 | $1,045 | $981 | -6.1% | 92.3% |
| B1 | 33 | 861 | $995 | $1,219 | +22.5% | 97.0% |
| B1P | 15 | 861 | $1,145 | $1,306 | +14.1% | 100.0% |
| B2 | 10 | 967 | $1,195 | $1,342 | +12.3% | 90.0% |
| B2P | 6 | 967 | $1,295 | $1,446 | +11.7% | 66.7% |
| Total / Avg | 304 | 662 | $929 | $1,015 | +9.4% | 87.5% |
| Project | Budget | Spent to Date | Status | Projected Cost | Savings (+/−) | |
|---|---|---|---|---|---|---|
| Completed | ||||||
| Exterior Power Washing | $54,000 | $50,550 | Completed | $50,550 | $3,450 | |
| Roof Replacement | $650,000 | $522,590 | Completed | $522,590 | $127,411 | |
| Washer/Dryer Installations | $532,000 | $394,811 | Completed | $394,811 | $137,189 | |
| Architectural / Design | $15,000 | $15,000 | Completed | $15,000 | — | |
| In Progress | ||||||
| Entryway Monument Upgrade | $50,000 | $33,958 | In Progress | $33,958 | $16,042 | |
| Clubhouse Remodel & FFE | $150,000 | $21,108 | In Progress | $150,000 | — | |
| Clubhouse Windows & Door Replacements | $36,400 | — | In Progress | $36,400 | — | |
| Landscaping & Common Area Upgrades (combined)† | $330,000 | $10,609 | In Progress | $306,319 | $23,681 | |
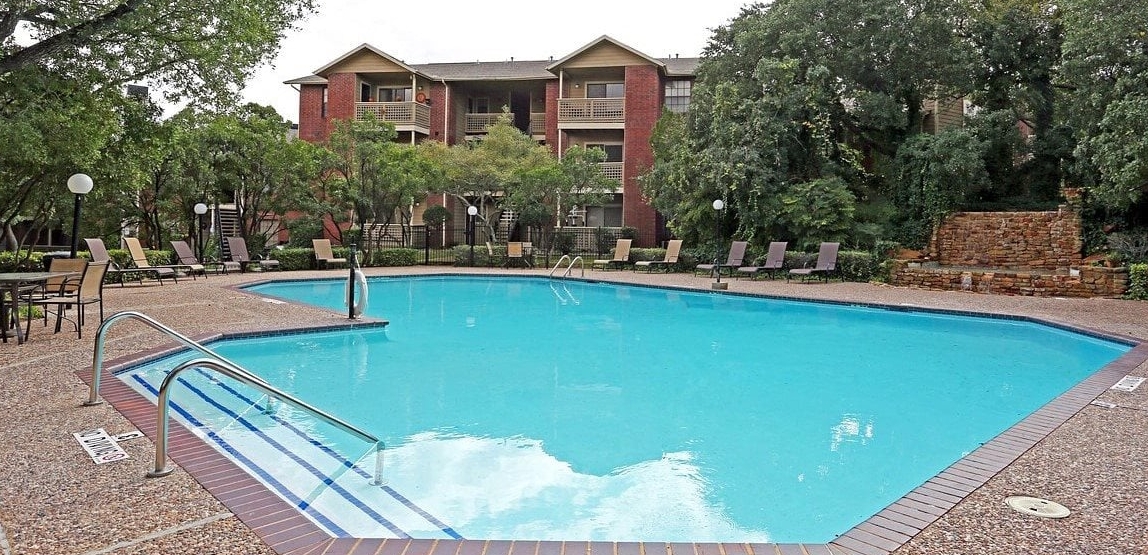
| Pool Area Upgrades (furniture) | $40,000 | — | In Progress | $32,000 | $8,000 | |
| Gym Upgrades | $30,000 | $26,700 | In Progress | $26,700 | $3,300 | |
| HVAC Full Replacements | $192,000 | $39,464 | In Progress | $192,000 | — | |
| Water Heater Full Replacements | $140,600 | $9,823 | In Progress | $140,600 | — | |
| Plumbing Repairs | $40,000 | $13,786 | In Progress | $40,000 | — | |
| Not Started | ||||||
| Asphalt Repairs & Trash Enclosures | $75,000 | — | Not Started | $75,000 | — | |
| Maintenance Shop Upgrade | $15,000 | — | Not Started | $15,000 | — | |
| Website / Marketing Redevelopment | $15,000 | — | Not Started | $15,000 | — | |
| Total Hard Costs | $2,365,000 | $1,138,398 | $2,045,927 | $319,073 | ||
| Contingency (10%) | $236,500 | — | Available | — | $236,500 still available | |
| Project Management Fee | $65,038 | $27,610 | In Progress | $65,038 | — | |
| Total Budget | $2,666,538 | $1,166,008 | $2,110,965 | $555,573 | ||
| Draw | Date | Amount |
|---|---|---|
| Draw 1 | Jun 2025 | $535,654 |
| Draw 2 | Sep 2025 | $208,078 |
| Draw 3 | Dec 2025 | $287,783 |
| Draw 4 | Mar 2026 | $100,475 |
| Total Reimbursed | $1,131,990 |
| Tranche A1 (Senior) | Tranche A2 (Supplemental) | Combined | |
|---|---|---|---|
| Loan Number | 6606066A1:0 | 6606066A2:0 | |
| Original Balance | $11,884,392 | $10,099,070 | $21,983,462 |
| Current Balance | $12,442,035 | $10,572,941 | $23,014,977 |
| Interest Rate | 6.55% | 6.55% | 6.55% |
| Maturity | 4/9/2028 | 4/9/2028 | 4/9/2028 |
| Apr '25 | May | Jun | Jul | Aug | Sep | Oct | Nov | Dec | Jan '26 | Feb | Mar | Q1 2026 | T12 Total | |
|---|---|---|---|---|---|---|---|---|---|---|---|---|---|---|
| Gross Interest Expense | — | (104,835) | (121,789) | (117,882) | (139,081) | (130,673) | (132,885) | (127,083) | (129,394) | (126,396) | (117,384) | (128,136) | (371,916) | (1,375,538) |
| Rate Cap Proceeds | — | — | — | — | 13,080 | 8,371 | 4,629 | 4,288 | 211 | — | — | — | — | 30,579 |
| TOTAL DEBT SERVICE | — | (104,835) | (121,789) | (117,882) | (126,001) | (122,302) | (128,256) | (122,795) | (129,183) | (126,396) | (117,384) | (128,136) | (371,916) | (1,344,959) |
• Market Context: Austin has moved from the peak of the supply shock into the early stages of rebalancing, but the right read is still stabilization rather than a clean broad recovery. The 1Q26 Austin snapshot still shows a clear vintage ladder rather than broad pricing power: effective rents run from $1,021 in 1980s product to $1,618 in 2020+ product, occupancy ranges from 91.4% to 93.7%, and YoY rent change remains negative across every vintage, from -11.8% in 1980s to -5.2% in 2010s.
• How the Curve Has Evolved: Demand largely kept pace with the supply wave through 1Q25, which is why the market did not break sooner despite extreme delivery volume. The real air pocket came in late 2025, when absorption fell to 2.0K in 3Q25 and turned slightly negative in 4Q25 while deliveries were still running near 3.5K to 3.7K units per quarter. In 1Q26, demand rebounded to 3,465 units against 2,409 deliveries, which is the first cleaner sign that the market is moving out of the worst part of the reset.
• Why Operations Still Feel Weak: The chart above is showing effective rent, and that measure is still negative in the Austin 1980s cohort at -11.8% YoY. The local Pflugerville/Wells Branch 1980s read is similar at -11.7%. Operations still feel weaker than that rent read because concessions remain heavy and same-store revenue is still lagging rent stabilization. Concession exposure is also elevated: 49.6% of metro 1980s units are offering concessions, and that rises to 66.6% in the local Pflugerville/Wells Branch 1980s set.
• Investment Read for 2026: The forward signal is now clearly better on supply. The current pipeline points to roughly 10.1K deliveries in 2026, 6.6K in 2027, and 2.2K in 2028, while starts, permits, and units under construction have all rolled sharply lower. That supports the normal apartment recovery sequence: stabilize occupancy first, burn off concessions next, and push pricing only after the resident base is firm again.
1980s hardest hit: -25% from peak metro-wide and -25.3% in Pflugerville/WB
1980s rent still under pressure: effective rent change is -11.8% in Austin and -11.7% in Pflugerville/WB
Concessions still active: 49.6% of metro 1980s units and 66.6% of local 1980s units are offering concessions
Recovery sequence: occupancy firms first, concessions burn off next, and durable rent growth follows after
| Product | Location |
|---|
Revenue remains the pressure point. EGI is still below acquisition-period levels because vacancy and concessions remain elevated as the team backfills occupancy in a hyper-competitive 1980s-vintage market, although other income improved materially quarter over quarter. Above-the-line operating expenses remain stable and generally below plan, while turnover-related capital is still running heavier than the original underwriting assumed.
Current Position
The cash-burn test and the lender coverage test are separate. Both need to be shown together here.
| Line Item | Jan '26 | Feb '26 | Mar '26 | Q1 Total |
|---|---|---|---|---|
| Reported Net Levered Cash Flow (Row 74) | (45,703) | (23,442) | (30,934) | (100,079) |
| Add back: Deferred asset management fee (Row 52) | 4,260 | 4,551 | 4,279 | 13,089 |
| Add back: Non-operating write-offs (Row 51) | 7,208 | 7,291 | 0 | 14,499 |
| Actual Cash Burn | (34,236) | (11,601) | (26,654) | (72,491) |
| Line Item | Balance | Notes |
|---|---|---|
| Owner reserve (notional committed) | $283,284 | — |
| Less: temporary business-plan outlay | ($160,880) | Reimbursed within 60 days via future fundings |
| Current liquid balance | $122,404 | Available today |
| Plus: business-plan reimbursement | +$160,880 | Next 60 days |
| Plus: bulk-internet door fee ($200 × 304 units) | +$60,800 | One-time liquidity event |
| Projected total (within 60 days) | $344,084 | Near-term liquidity ceiling |
Path to 1.05x by September
The sensitivity is now shown by occupancy case, with the other operating assumptions held constant.
| Line Item | Balance |
|---|---|
| ASSETS | |
| Current Assets | |
| Cash | |
| Petty Cash | 250 |
| Cash-DACA | (27,559) |
| Operating Cash | 67,931 |
| Cash Other — Security Deposits | 90,124 |
| Cash Other — Capital Reserve | 283,284 |
| Total Cash | 414,030 |
| Cash in Reserve / Escrow | |
| Tax Escrow | 150,870 |
| Insurance Escrow | 146,647 |
| Reserve Replacement | 25,191 |
| Capital Improvements | 49,515 |
| Total Cash in Reserve | 372,222 |
| Accounts Receivable | |
| Accounts Receivable — Rent | 7,980 |
| Other Receivable | 10,278 |
| Allowance for Doubtful Accounts | 9,718 |
| Due to/from Buyer-Seller | (5,741) |
| Total Accounts Receivable | 22,234 |
| Prepaid Expenses | |
| Prepaid Property Insurance | 69,499 |
| Prepaid Other Insurance | 37,275 |
| Prepaid Payroll | 53,304 |
| Prepaid MIP | 4,221 |
| Miscellaneous Prepaid | 1,334 |
| Total Prepaid Expenses | 165,632 |
| Total Current Assets | 974,119 |
| Fixed Assets | |
| Land | 2,815,831 |
| Buildings | 32,382,060 |
| Roofing & Roofing Improvements | 535,654 |
| Loan Fees | 297,688 |
| Total Fixed Assets | 36,031,233 |
| Other Long-Term Assets | |
| Deposit — Water | 22,857 |
| Total Other LT Assets | 22,857 |
| TOTAL ASSETS | 37,028,209 |
| LIABILITIES & OWNER'S EQUITY | |
| Current Liabilities | |
| Accounts Payable | 45,857 |
| Other Payable | (5,426) |
| Accrued Mortgage Interest Payable | 2,780 |
| Misc Accrued Expenses | 6,794 |
| Unclaimed Property | 736 |
| Payroll Clearing Account | 0 |
| Prepaid Tenant Rent | 16,023 |
| Security Deposits | 83,378 |
| Pet Deposits | (450) |
| Total Current Liabilities | 149,691 |
| Tax Liabilities | |
| Property Tax Payable | 159,055 |
| Texas Margin Tax Payable | 7,333 |
| Total Tax Liabilities | 166,388 |
| Long-Term Liabilities | |
| Mortgage Payable (A1) | 12,500,000 |
| Mortgage Holdback (A1) | (57,965) |
| Mortgage Payable (A2) | 12,000,000 |
| Mortgage Holdback (A2) | (1,427,059) |
| Total Long-Term Liabilities | 23,014,977 |
| TOTAL LIABILITIES | 23,331,056 |
| Owner's Equity | |
| Capital Contribution — Investors | 14,468,009 |
| Prior Year Distributions | (85,938) |
| Retained Earnings (Prior) | (456,754) |
| Current Earnings | (228,164) |
| Total Owner's Equity | 13,697,154 |
| TOTAL LIABILITIES & EQUITY | 37,028,209 |